VisionGauge® Remote Program Communications to Integrate Quality Inspection into Industrial Automation

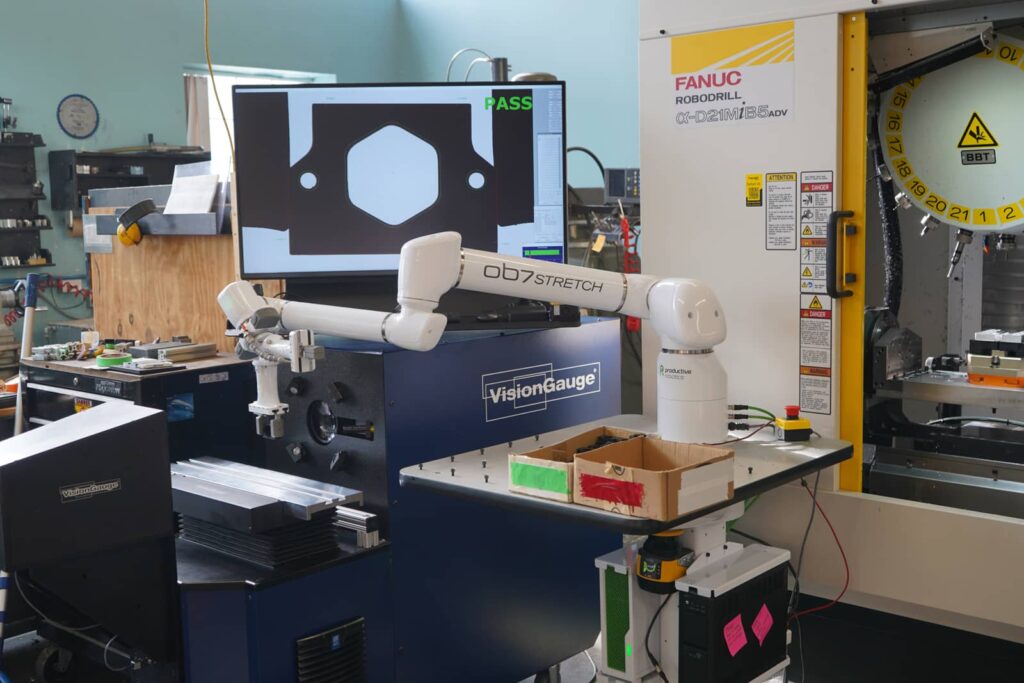
VisionGauge® Digital Optical Comparator’s Remote Program Communications feature makes it easy to interface with a robot or other part-positioning equipment to coordinate quality inspection operations. When enabled, VisionGauge® OnLine responds to commands/signals using various communication capabilities (TCP/IP communication via Ethernet, up to 48 digital I/O’s with our Automation Module, etc.) to load and monitor programs, retrieve results, process errors and messages, and more. Combined with VisionGauge® OnLine’s extensive automated toolset, this feature completes the communication feedback loop for 100% lights-out, responsive quality inspection automation for integration with other systems performing related tasks.

Direct machinery robotic interface for visual inspection with VisionGauge

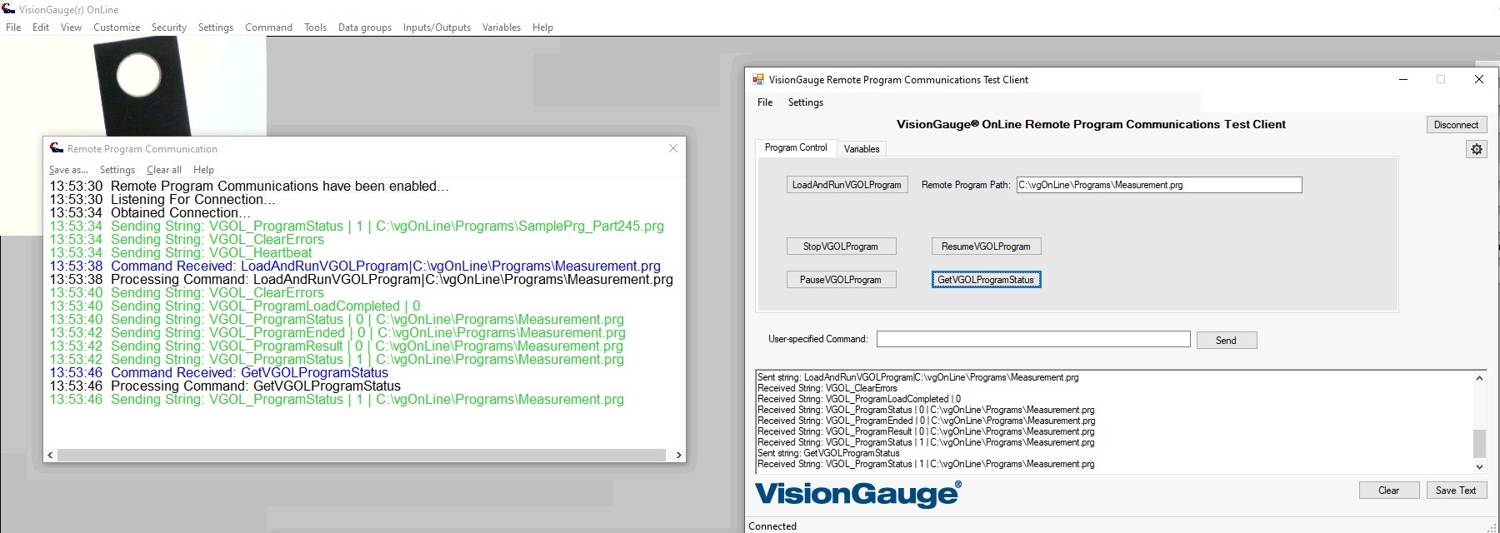
VisionGauge® OnLine Remote Program Communications feature is accessible through the software via user-configurable commands/responses using TCP/IP protocol over Ethernet or even WiFi at the data link layer to enable full 2-way handshaking for error/result reporting, remote control over automated program operations, and more directly over a network.

A separate Automation Module can be added to VisionGauge® systems to include responsive Input Monitoring and Output Conditions over digital I/O channels configured for 0-5V Low/High signals. These features allows users to configure specific hardware-level digital output channels on which to output a signal when a certain condition is met during a operation of the system and to select a digital input channel to monitor for a signal to perform a specific action in the software. The combination of these tools provides a customizable level of control over processes and communications with controllers, including visible/audible outputs and signals, process Stop/Go commands, error signaling, and much more.

Simplified TCP/IP Communications for Quality Inspection and Industrial Automation

Controllers tasked with running and monitoring an inspection cell or a specific process can easily connect with VisionGauge® OnLine over a network and exchange commands/responses with the software to monitor and coordinate an entirely automated quality inspection process.

Remote Program Communications supports various commands, including:

  • Loading and Running a specific program filepath
  • Setting or Retrieving general purpose string or numerical variables
  • Obtaining or setting the running status of a program (Start/Stop/Pause)

VisionGauge® OnLine can be configured to send updates/responses under various conditions with user-customizable string pre-fixes:

  • User-defined Heartbeat or Keep-Alive interval command to monitor software runtime status
  • Error messages or notifications issued by the software (even when ‘silent mode’ is activated during a program run)
  • Confirmation of requests/commands
  • Program results, status, and termination updates

A convenient test utility is available for setup and command testing.

Remote Program Communications demonstration

Digital Inputs Monitoring and Output Conditions

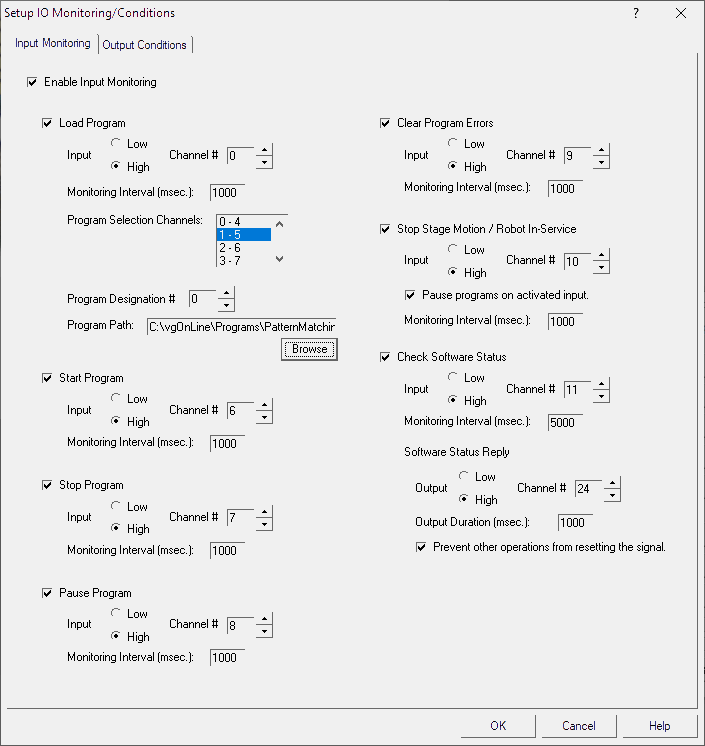
Input Monitoring allows digital input channels to be periodically scanned for a signal. When the target channel is activated, the software will perform specific actions. VisionGauge® OnLine supports many input signal monitoring actions, including:

  • Loading a program
  • Starting/Stopping/Pausing/Resuming a program
  • Clearing program errors
  • Stop/Prevent stage motion
  • Check software’s status (to verify the software is still alive and responding)

Additional input signals can be processed during automated programs for a variety of steps, including coordinating image capture, waiting for signals before proceeding, setting up result variables for conditional processing, and more.

A safety E-Stop button is also included in the Automation Module that automatically stops all motion and terminates a running program when triggered.

Digital Input Monitoring

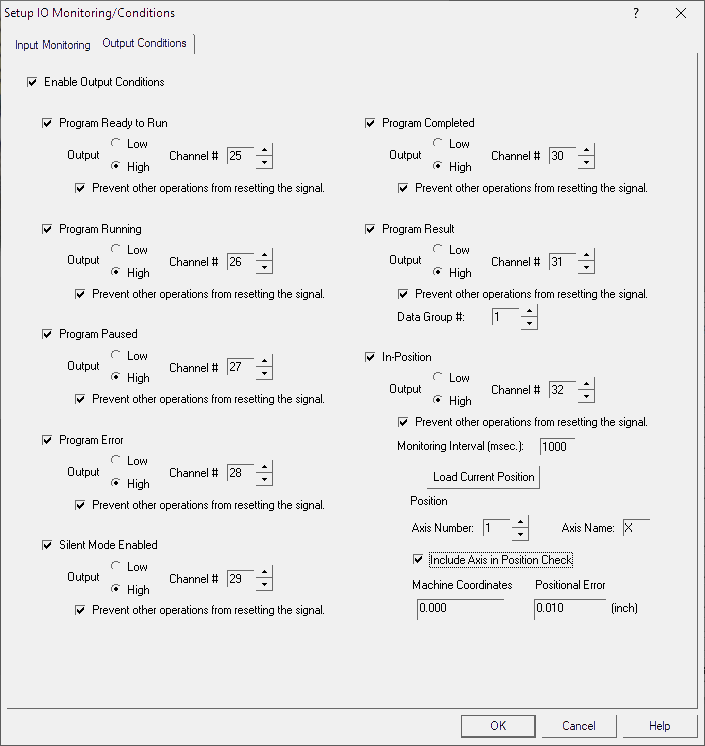
Output Conditions allow the user to configure digital output channels to be activated when certain conditions are met during software operation. VisionGauge® OnLine supports outputting a signal when various conditions are met or actions are performed:

  • Program is loaded and ready to run
  • Program status: Running/Paused/Completed
  • Program error
  • Silent Mode is enabled
  • Program Result (Pass/Fail)
  • In-Position (Stage is at a certain position)

Additional output is possible through automated programs, including individual inspection and measurement Pass/Fail results based on tolerances, data set testing, and conditional program flow configurations (e.g. looped program commands that experience specific program conditions, program timing options, etc.).

Output channels can be reserved so programs and operators cannot accidentally trigger output on dedicated channels.

VisionGauge OnLine's Digital Output Conditions

Contact us with your application requirements, and visit our Applications page for examples of applications we can solve.

VisionGauge® Thread Inspection & Measurement

Fast, Easy, and Accurate Inspection and Measurement of Threads

VisionGauge®’s advanced thread inspection tools perform automatic measurements on a wide range of parts with threads (not just limited to screws!). These non-contact measurements ensure that the related geometric aspects defining the threads conform to their manufactured specifications.

Thread measurement results are produced extremely quickly and can be included as part of an automated program or as a manual measurement by an operator. Completing thread measurements is as simple as selecting which measurements to report, then drawing a region of interest that includes the top and bottom threads. The tool is reliable and robust, and no mylars or overlays are required to complete the measurements.

Overview Video

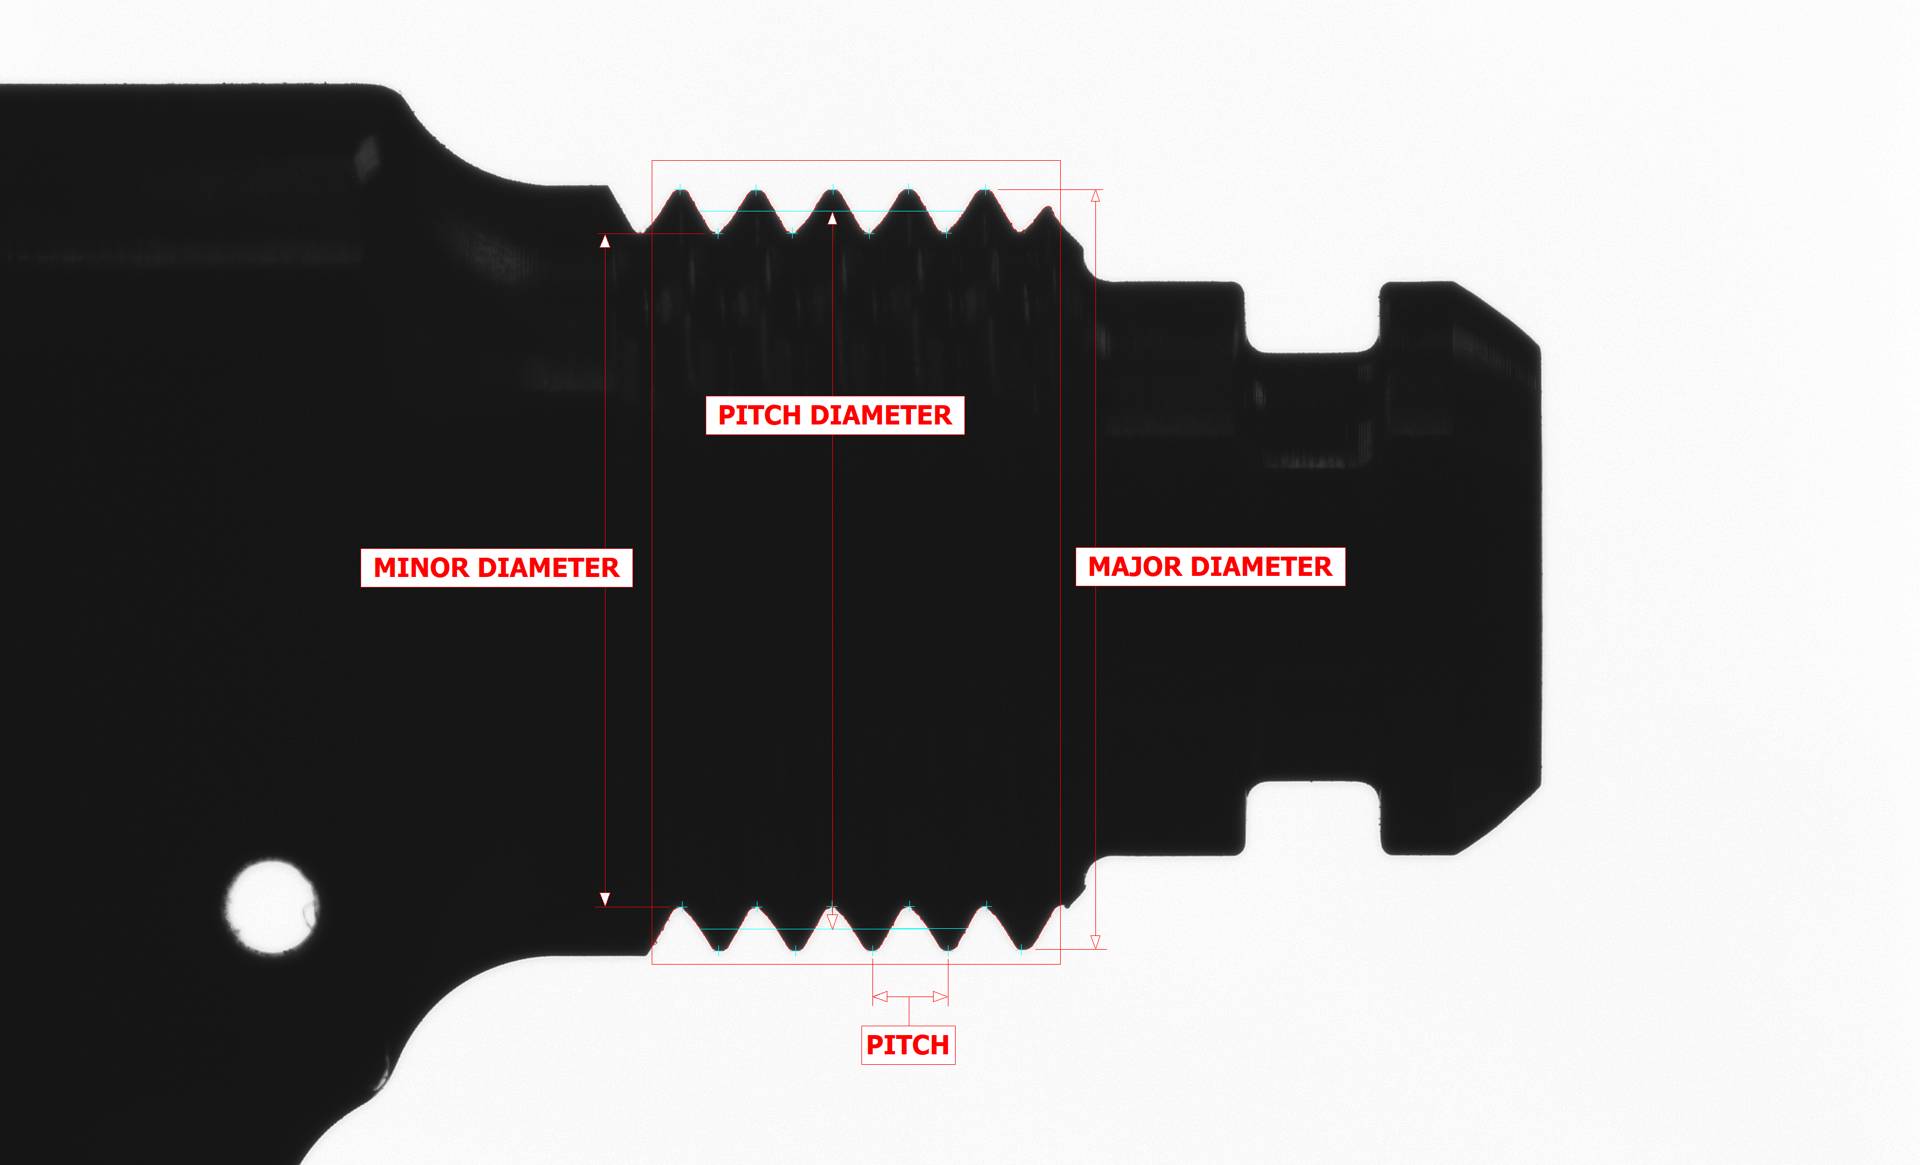
Thread feature measurements currently able to be reported:

  • Average minor diameter
  • Average major diameter
  • Average pitch diameter
  • Minimum pitch diameter
  • Maximum pitch diameter
  • Average pitch

Measurement tolerances can be applied for Pass/Fail values, and complete results can be sent to various output channels (collected in Data Groups, export to Excel, SPC software, text file, etc.).

Specific points calculated from the measurements can also be saved as Datums for re-use in further measurements:

  • Top/Bottom maximum crest/root positions
  • Center of average major diameter
  • Center of average pitch diameter

With our supplementary rotary stage, thread runout can be easily measured by using the saved centers as datums.

Results are fast, accurate, and fully-automated, producing operator-independent results each time.

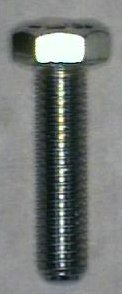
screw threads measurements with VisionGauge®

Download the Thread Inspection and Measurement Application Note in .pdf format.

Contact us with your application requirements, and visit our Applications page for more examples of applications VisionGauge® Digital Optical Comparators can solve.

Advanced Auto-Pass/Fail Analysis & Report Tools

VisionGauge®’s new Advanced Auto-Pass/Fail Analysis and Report tools allow operators to easily review, explore, and label CAD Auto-Pass/Fail™ results at each cross section of interest in the field-of-view.

These Analysis and Report tools are available when loading a CAD file that has defined entity-based CAD Auto-Pass/Fail™ sections. Entities supported include those created automatically by reading in minimum/maximum tolerance files and manually created entities.

Overview Video:

After a CAD file has been loaded and aligned to a part using the VisionGauge® CAD Auto-Align™ tool, the operator can enter either the Analysis or Report mode:

CAD Auto-Pass Fail™ Results Analysis

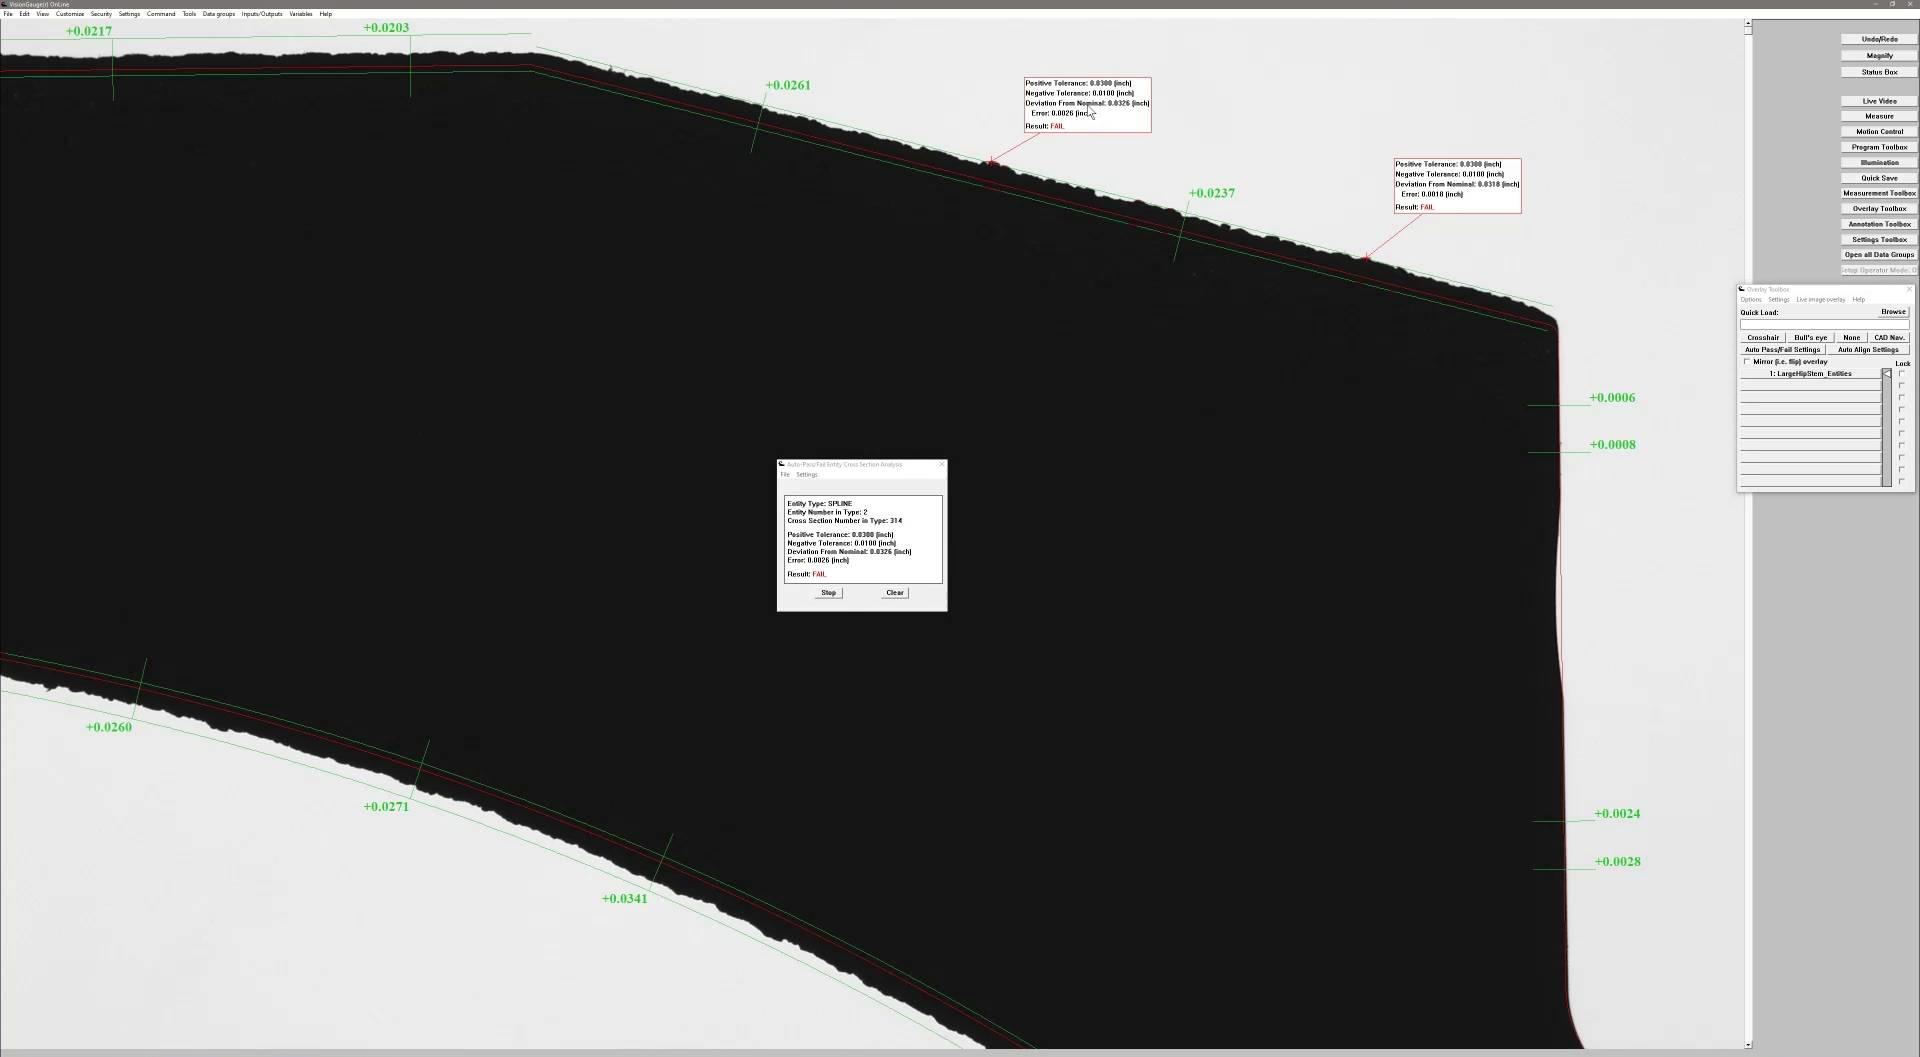
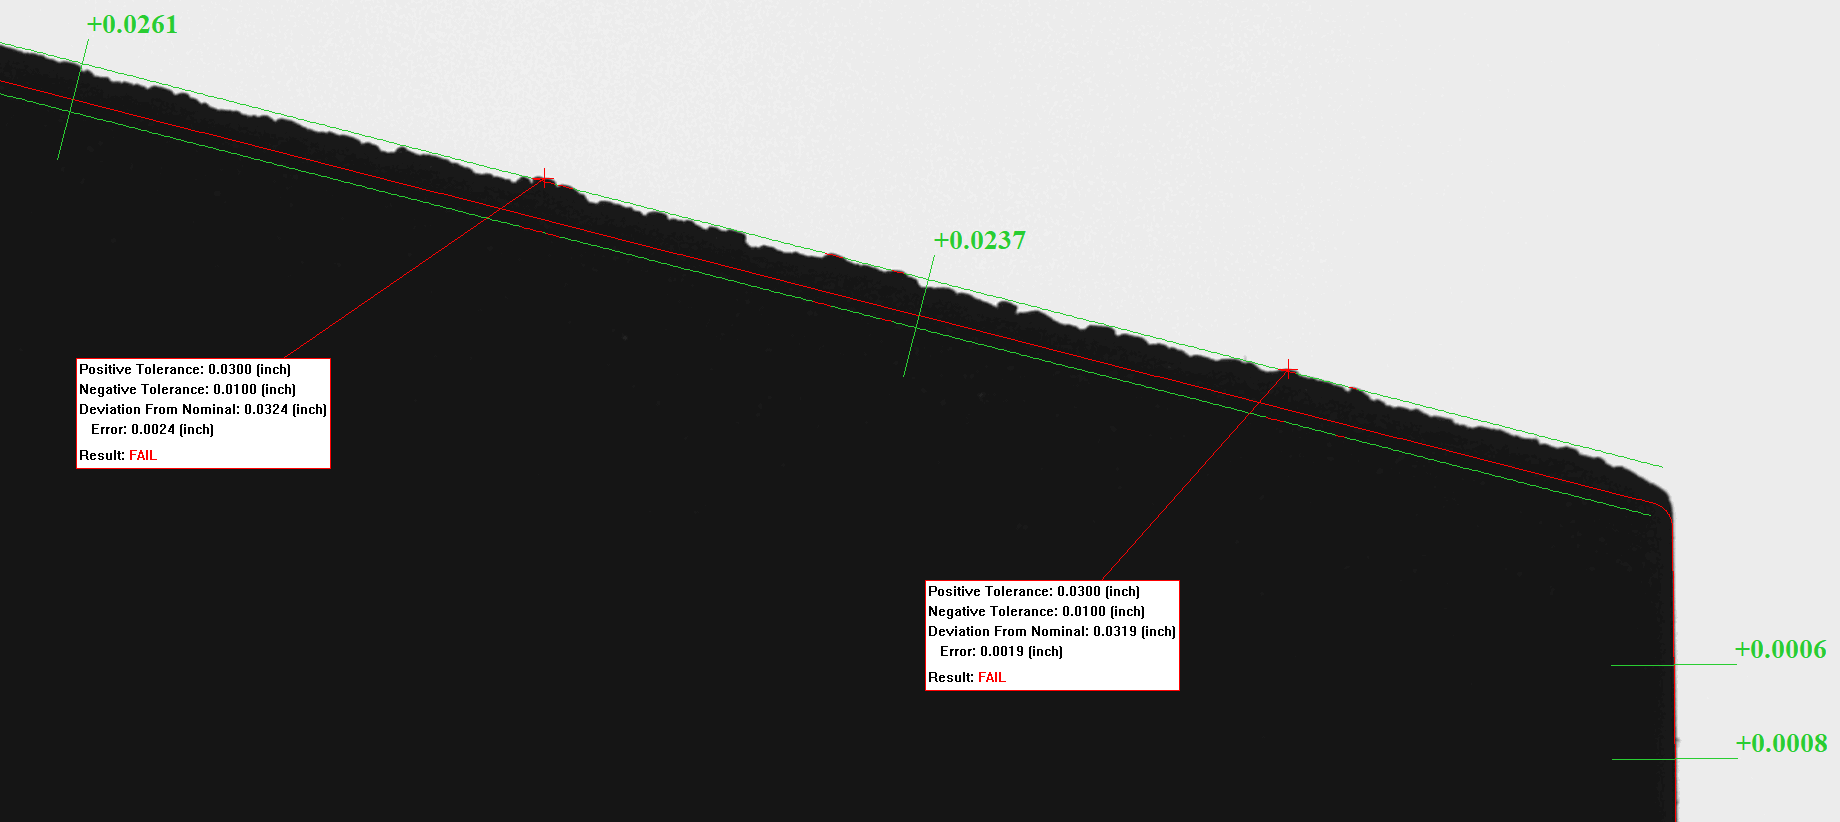
VisionGauge®’s CAD Auto Pass/Fail™ Entities Cross Section Analysis mode permits operators to hover the mouse cursor over an entity to snap to a cross section and display the inspection results at this position. This is extremely useful to scan through difficult inspection areas and see the exact inspection results at various point locations along an entity. A crosshair is drawn over the actual edge point found on the part at that cross section.

CAD Auto-Pass/Fail Entity Cross Section Analysis on a Hip Stem

Selecting the mouse button on a highlighted cross section starts an annotation operation where the operator can draw a label with the cross section result on the image. Clicking the mouse again fixes the label in the current position. Multiple labels can be drawn on a single image to highlight various inspection location results.

The selected entity cross section information is displayed in the CAD™ Auto Pass/Fail Entities Cross Section Analysis window, including the Entity type, the number of the entity type (in the CAD file), the selected cross section number of the entity type, the positive/negative tolerances, deviation from nominal and error, if applicable, as well as the cross section Pass/Fail result.

CAD Auto-Pass/Fail Cross Section Analysis of a Hip Stem

Analysis settings allow the operator to minimize the amount of data displayed in the label and control if all inspection points can be highlighted or only  failed results, increasing efficiency when exploring only out-of-tolerance regions.

When the current Analysis has been completed, the user can choose to Save or Print the image with the annotations.

CAD Auto-Pass Fail™ Results Report

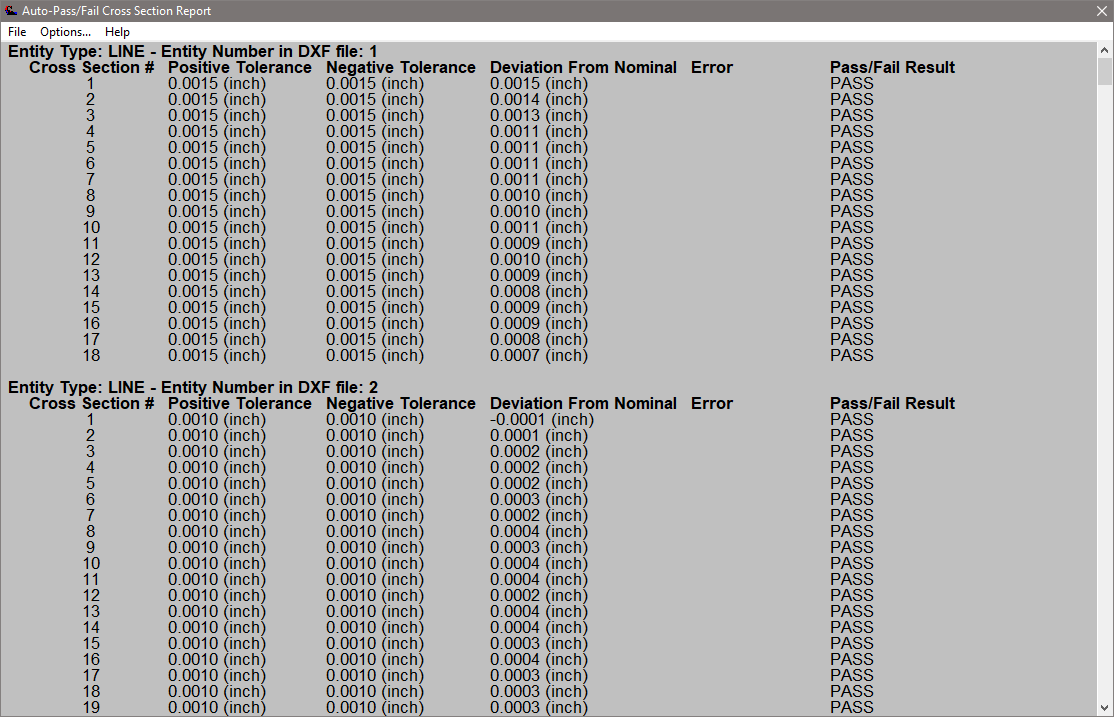
The CAD™ Auto Pass/Fail Entities Cross Section Report mode activates a scrollable report to display information about all cross section inspection points in the current field of view.

CAD Auto-Pass/Fail Entity Cross Section Report on a Fir Tree Inspection
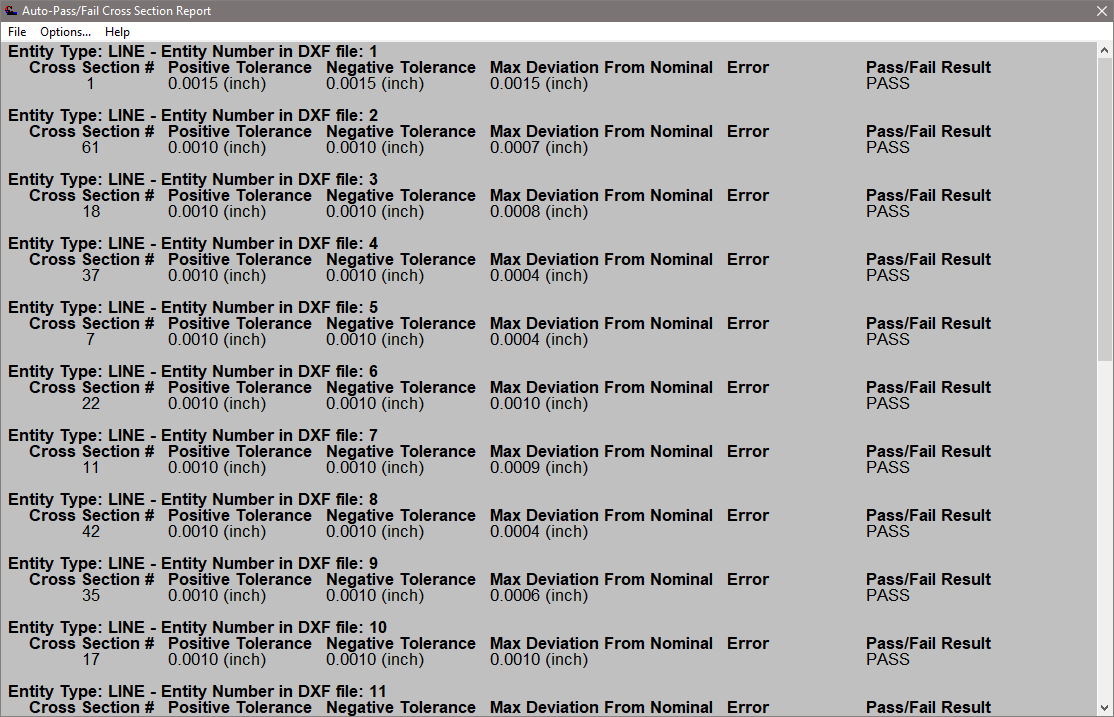
CAD Auto-Pass/Fail Entity Cross Section Report Displaying Maximum Deviation per Entity

The displayed results are customizable with filters to condense the report to only the dataset of interest. Apply filters to the current field-of-view data for a streamlined report showing only Failed results or the maximum deviation from nominal per entity to easily illustrate why a part failed inspection.

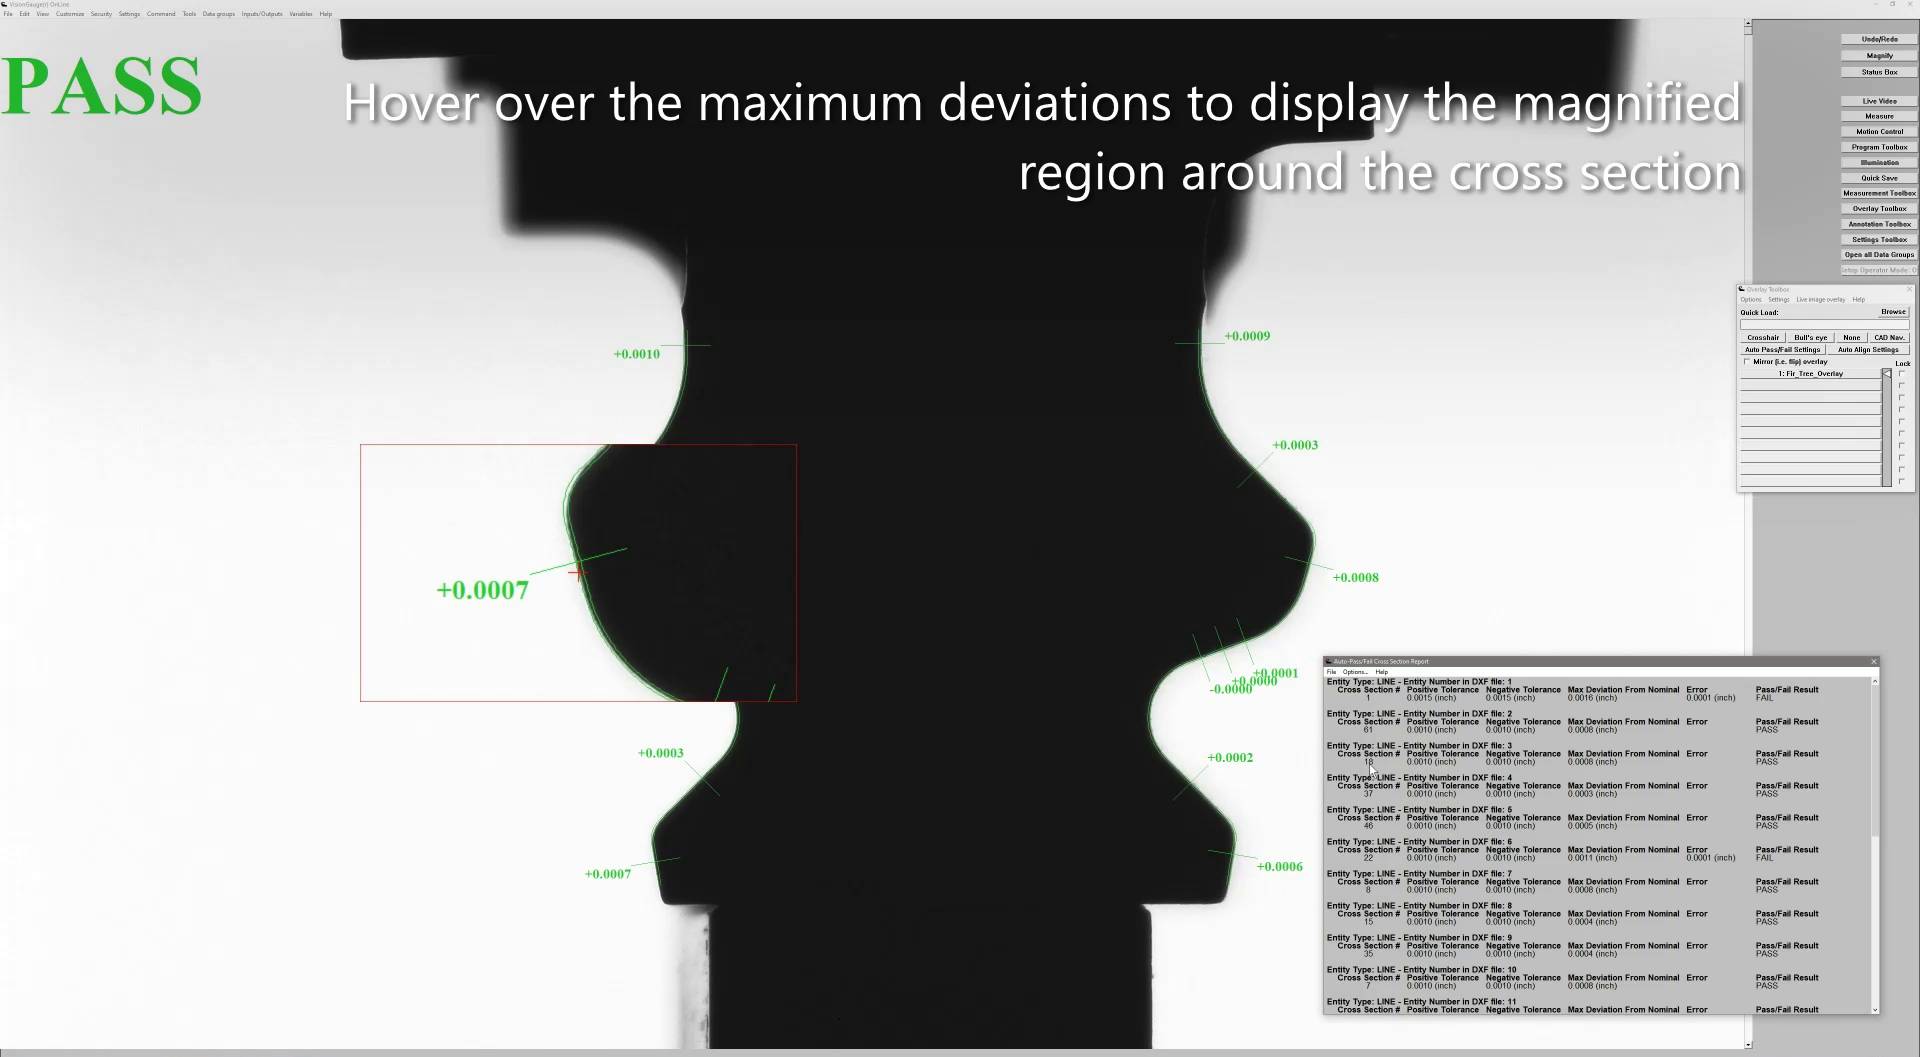
CAD Auto-Pass/Fail Entity Cross Section Analysis on a Fir Tree Inspection

From the report, the operator is able to navigate through all Auto-Pass/Fail Cross Section results (per entity) displayed in the current field-of-view. Hovering the mouse over an entry in the report will highlight the part’s edge at that cross section and magnify the surrounding inspection region for an easy and intuitive review of the result.

The selected entity cross section information displayed in VisionGauge®’s CAD Auto Pass/Fail™ Entities Cross Section Report includes the entity type, the number of the entity type (in the CAD file), the selected cross section number in the entity type, positive/negative tolerances, deviation from nominal and error, if applicable, and the Pass/Fail result at that location.

All cross section edge point positions (X, Y) for this field-of-view inspection can also be saved as a .CSV file or as a simple .DXF file with POINT entity locations for additional review outside of VisionGauge®.

Contact us with your application requirements, and visit our Applications page for more examples of applications VisionGauge® Digital Optical Comparators can solve.
VisionGauge® Pattern Matching Tools to Identify, Locate, and Verify Objects & Features

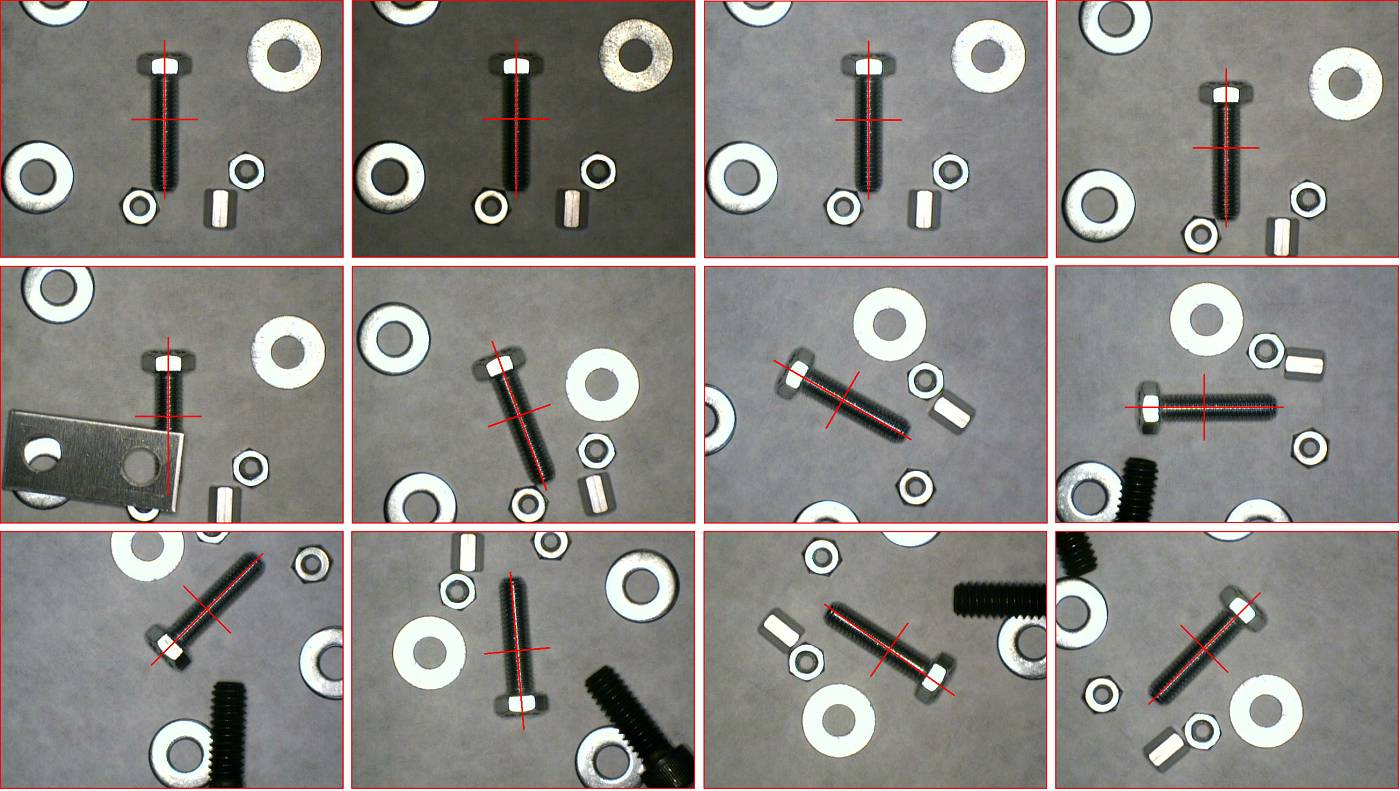
VisionGauge® has powerful pattern matching tools adapted to solve a wide range of applications. These tools can be used to identify and accurately locate objects in images and features on objects. There are absolutely no limitations on the number of objects and features. They can act as feature and object recognition tools and detect multiple instances of parts and features.

VisionGauge’s® pattern matching tools:

  • Are adapted for arbitrary objects & features
  • Are robust to additional parts & features in the image
  • Can handle partial occlusion and are robust to partial deformations
  • Are suited to arbitrary orientations
  • Can deal well with variations in illumination and are tolerant to noise

Their performance has been optimized and they are fast. They are very flexible and widely-applicable. And they are very easy to setup and very easy to use. VisionGauge’s® pattern matching tools are perfect to locate objects and features and carry out defect detection.

Screw pattern matching pattern
Pattern matching tools examples

Download a copy of this Application Note in .pdf format.

Contact us with your application requirements, and visit our Applications page for examples of applications we can solve.

VisionGauge® Edge Break Measurement Tool

An edge break consists in smoothing a corner that otherwise would be too sharp, most often using either a chamfer or a radius. The objective is generally to ensure part longevity, safe handling, and proper performance.

sharp edge - edge breaks

Sharp Edges

Edge Breaks - Chamfered edges

Chamfered Edges

Edge Breaks - Rounded edges

Rounded Edges

There is no GD&T symbol for edge breaks and they are not referenced in the ASME Y14.5 standard. Nevertheless, VisionGauge® systems are perfectly suited for measuring edge breaks, either using overlays or the new VisionGauge® edge break measurement tool.

VisionGauge®’s edge break measurement tool is suited to sharp, rounded, and chamfered edges. The tool automatically locate the edge break’s tangent points, to very high accuracy, and there are no limitations as to the angle at which the edges meet.

VisionGauge®’s edge break measurement tool is robust and filters our spurious noise (i.e. disregards point imperfections and defects such as contamination, “mouse-bites”, etc…) to obtain the true best-fit line. Measurement results are fast, repeatable, and completely operator-independent.

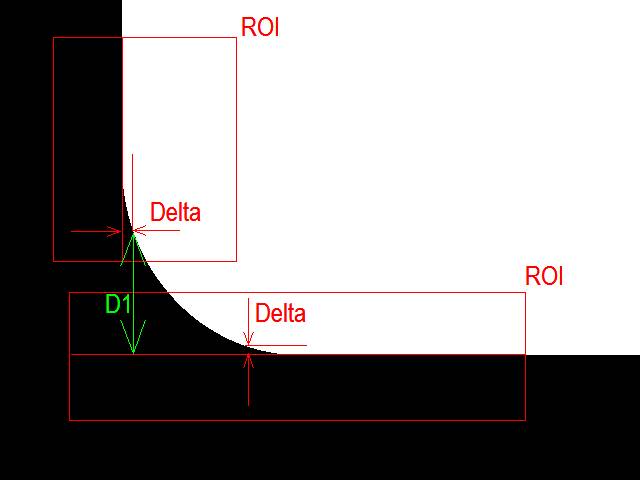
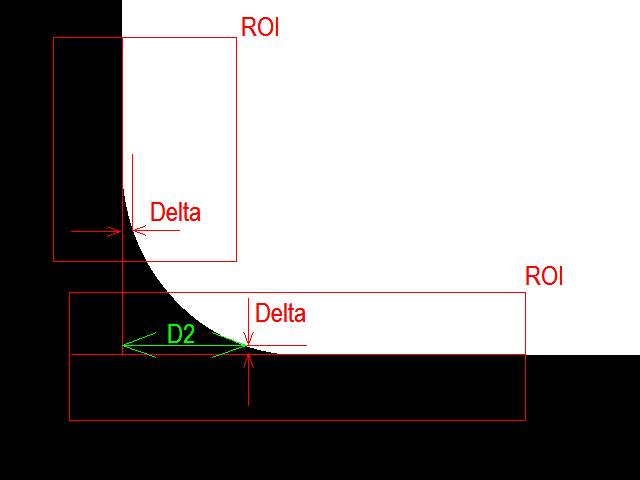
The VisionGauge® edge break measurement tool also has user-selectable parameters for demanding applications (e.g. the allowed “Delta” variation in distance from the calculated line before locating an edge break, etc…).

Automated edge break measurements - 1
Automated edge break measurements

This tool is available for both manual and fully-automated measurements (i.e. it can be included in an automated program). The edge break location can be saved as a datum and re-used in later measurements for fast and highly-accurate program results.

VisionGauge®’s edge break measurement tool is fully-integrated into the VisionGauge® Digital Optical Comparator’s software:  This means that VisionGauge’s® multi-level password protection will be available, reports can be produced, all of the data & results can be databased, sent to external applications, etc, etc, etc…

Contact us with your application requirements, and visit our Applications page for more examples of applications VisionGauge® Digital Optical Comparators can solve.
VisionGauge® Motorized Systems and Automation Features

Auto-Mosaic Tool (Auto-Stitch or Automatic Image Stitching)

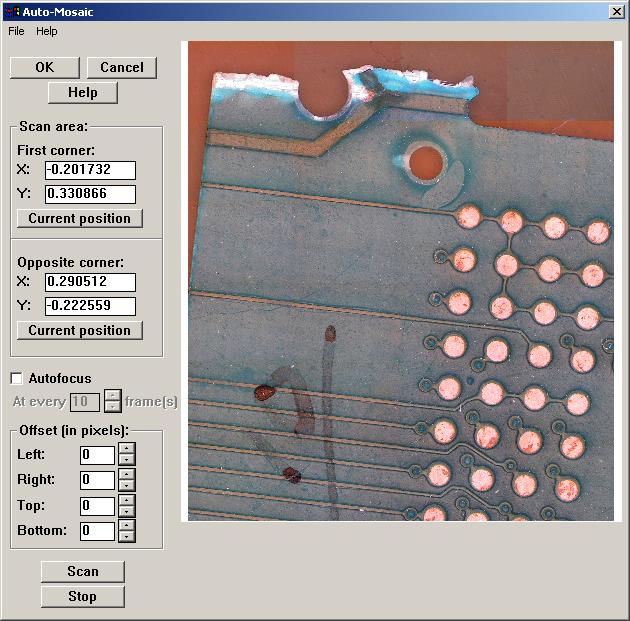
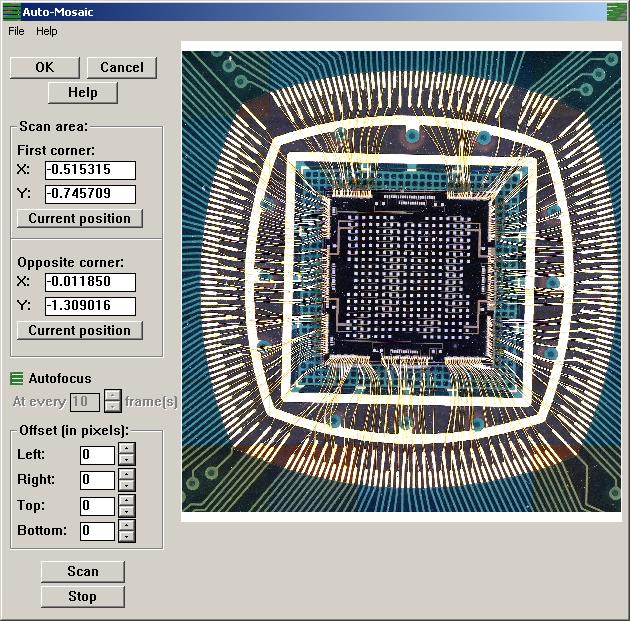
VisionGauge®’s “Auto-Mosaic” Tool (or automatic image stitching) allows you to automatically build a very high-resolution image of areas that are larger than your system’s optical field of view. This feature is available in Motorized Stage systems.

VisionGauge®’s “Auto-Mosaic” Tool is very easy to use:  Simply select two opposite corners of the area that you are interested in and press the “Scan” button. VisionGauge® does everything else! You can also tell VisionGauge® to periodically refocus the image or ignore a certain number of rows & columns of pixels on each of the different borders of each field-of-view. This allows you to compensate for uneven illumination, for example.

Finally, please note that the maximum size of the resulting image (and thus the maximum area that you can scan at any one time) is only limited by your computer’s system memory.

Download a .pdf with information about VisionGauge®’s “Auto-Mosiac” tool.

High-Accuracy Automated Volume Measurement Tool

VisionGauge® high-accuracy automated volume measurement software tool is:

  • Extremely easy to use
  • Fast
  • Produces very repeatable measurements, and
  • Yields operator-independent results

It produces:

  • a numerical value of the measured volume (you can select different metric or imperial units),
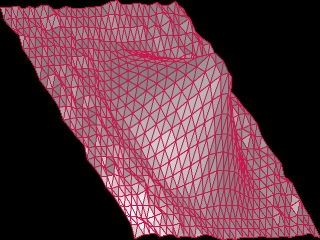
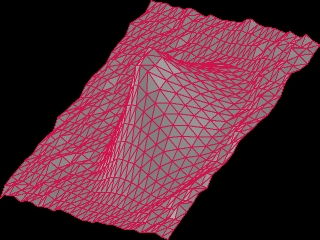
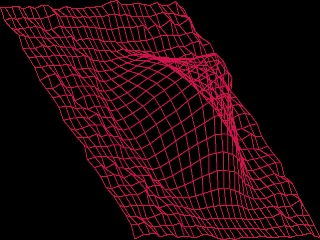
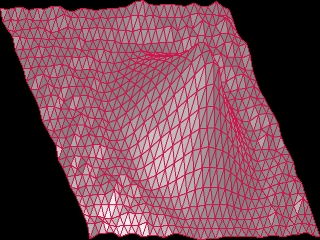
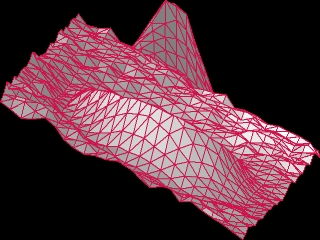
  • 3D surface plots (with an adjustable mesh coarseness, with either wire-mesh or surface rendering, and either with or without illumination modeling). These automatic 3D surface plots – which can be viewed from any perspective and rotated along all 3 axes – are very useful for properly viewing the sample from all angles and getting a good understanding of it.

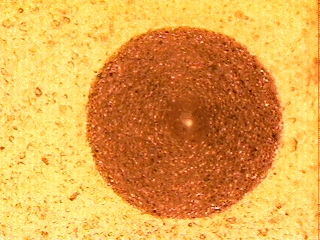
The 1st image is “what the camera sees”. The other images are different automatic 3D plots of the computed surface.

Of course, VisionGauge®’s fully automated high-accuracy volume measurement tool is perfectly integrated with VisionGauge®’s wide range of easy-to-use statistics, data collection, databasing, and reporting tools.

Download a .pdf with information about VisionGauge®’s full-automated volume measurement tool.

VisionGauge® Video Sequence Capture, Live Image Overlays, & Additional Features

VisionGauge® Support for DXF Format CAD Files With “Part Tracking”

Powerful & easy to use:

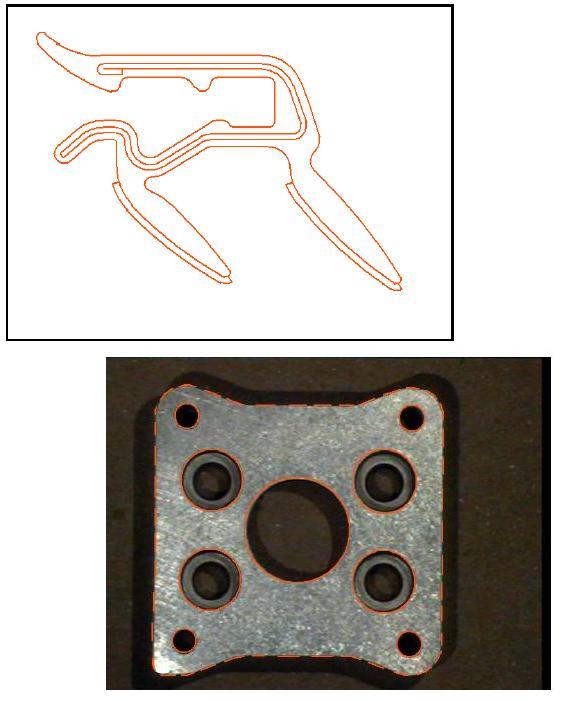
VisionGauge®’s Live Image Overlay Builder supports DXF-format CAD files. When you read a DXF file into the Live Image Overlay Builder, VisionGauge® can automatically scale the drawing to match up with the system calibration. This means that if the item measures one inch in the CAD drawing, it will appear on the screen as a one-inch object under the camera.

This is the perfect tool to use when comparing a part against its CAD drawing; VisionGauge® scales the CAD drawing appropriately and draws it “on top” of the part! VisionGauge®’s Live Image Overlay software tool with DXF-format CAD file support allows you to quickly determine how well a part matches up with its CAD file definition.

And when you use this tool with a stage (either manual or motorized), the overlay can move with the part. By having the overlay “track the part” in this way, you can carry out inspections and compare the part with the CAD overlay drawing at higher magnifications, outside of the field of view.

Other display options are also available: for example, you can scale the CAD drawing to fit inside the image or you can specify your own scaling coefficient.

For more advanced CAD overlay handling and part comparison, including our patented CAD Auto-Pass/Fail™ and CAD Auto-Align™ features, learn about our ground-breaking VisionGauge® Digital Optical Comparator systems.

Download a .pdf with information about VisionGauge®’s DXF overlay tools

Full Frame-Rate Video Sequence Capture Tool

VisionGauge®’s powerful Video Sequence Capture tool allows full frame-rate video capture (or slower, if specified by the user) to system memory. Once captured to memory, the video can be played back, modified, saved to disk, and retrieved later on, etc… The amount of video that can be captured (i.e. duration) is only limited by system memory.

VisionGauge® can save the video to disk as a sequence of individual bitmap images or as an “*.avi” movie file that can be played by other media applications. This tool is especially useful for time-dependent processes, motion tracking, etc…

In all cases, the video is captured and saved at full resolution and without compression, in full color and at full video frame-rate.

VisionGauge®’s Video Sequence Capture tool supports both analog and digital cameras.

Download a .pdf with information about VisionGauge®’s Video Sequence Capture tool.

Programmable Computer-Controlled Illumination

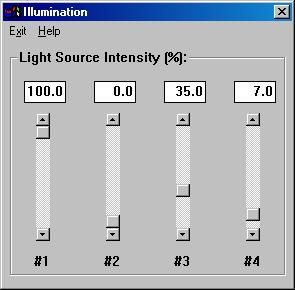
VisionGauge®’s programmable computer-controlled illumination option:

  • Is extremely easy to setup and configure
  • Is easy-to-use and has a very simple and intuitive interface
  • Allows you to control up to 4 individual light sources
  • Is fully programmable (i.e. allows you to program different repeatable light configurations & intensities at different measurement points)
  • Proven to increase measurement repeatability in machine vision inspection
  • Is perfectly integrated with all of VisionGauge®’s other tools

Download a .pdf with information about VisionGauge®’s programmable computer-controlled illumination.

Motorized Zoom and Focus Optical Systems

VisionGauge® includes built-in support for motorized optical systems. With VisionGauge®, you can motorize both the zoom and focus axes, using either stepper motors or encoded servo-motors. VisionGauge® has a simple and intuitive interface that gives you full control over your motorized optical system.  Motorized optics are available in both operator-driven and fully-automated systems.
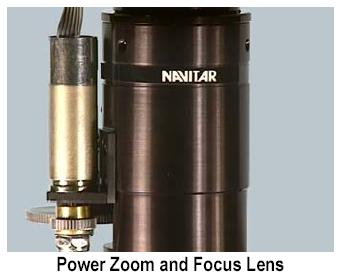
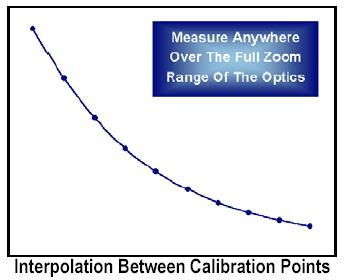
Measure at ANY zoom position over the full zoom range:

With encoded motorized zoom optics, VisionGauge® is continuously aware of the system’s optical magnification as you zoom in and out. This means that VisionGauge® is able to:

  • Carry out high-accuracy measurements at any time over the full zoom range of the optics
  • Go to programmable and repeatable zoom positions

VisionGauge®’s calibration procedure for encoded motorized zoom optics is very straightforward. The user begins by indicating the number of calibration points that he wants to enter and VisionGauge® distributes these points uniformly over the full zoom range of the optics. For each calibration point, VisionGauge® then brings the optics to the appropriate zoom position and prompts the user to carry out a simple field-of-view calibration. Once all of the points have been entered, VisionGauge® saves the calibration data to disk. This calibration data can be password-protected. VisionGauge® will then automatically read-in the calibration data on startup. And even though you only need to calibrate VisionGauge® at a limited number of zoom positions, VisionGauge® is able to carry out high-accuracy measurements at any position over the full zoom range of the optics by interpolating very accurately between the calibration points.

Motorized optics are another powerful tool that VisionGauge® puts at your disposal to easily and effectively solve difficult inspection and measurement applications.

Download a .pdf with information about VisionGauge®’s Motorized Zoom and Focus Optics.

VisionGauge® Counting & Sizing and Image Analysis/Processing Tools

VisionGauge® Counting & Sizing (Blob Analysis)

Reliable object thresholding and analysis:

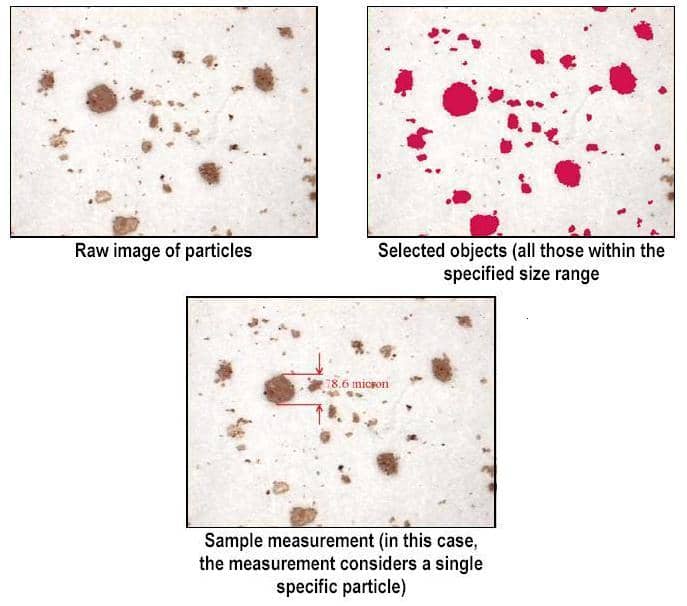
VisionGauge®’s powerful and easy-to-use “Counting & Sizing” feature will let you analyze particles, grains, inclusions, cells, and other similar objects.

You can separate the objects from the image background based on either red, green, or blue channel values as well as luminance, intensity, hue, or saturation values. Using both lower and upper limits, you define where the objects are located in the histogram. Once you have set this range, you can also set limits on the object area. Once again, both lower and upper limits are available (i.e. you can instruct VisionGauge® to only consider those objects that have an area greater or equal to a certain lower limit and smaller or equal to a certain upper limit).

Counting & Sizing

You can define a region of interest in order to limit the “Counting & Sizing” tool’s scope to a user-selected portion of the image rather than the entire image. These limits can be entered manually or drawn directly onto the image. This blob analysis software tool can also be instructed to remove individual particles from the sample and to disregard any objects that touch region of interest’s borders.

The “Counting & Sizing” tool can also be used to obtain information about individual objects. You can easily obtain the area, projection, and the equivalent diameter of an object simply by clicking on it.

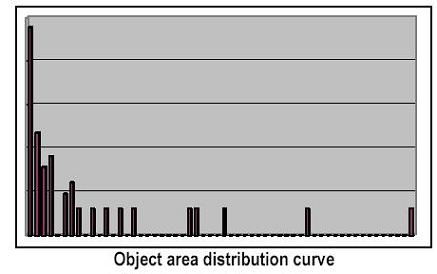
All of these adjustments are very easy to carry out because, as you work and refine the different parameters, VisionGauge® interactively updates all of the numerical results and graphs as well as the image of the individual objects. Results include the number of objects, the minimum, maximum, average, and median object areas, as well as the object area distribution curve.

VisionGauge® Counting and Sizing

Download a .pdf with information about VisionGauge®’s Counting & Sizing tool

Image Processing Software Tools for Image Analysis

Powerful & easy to use:

VisionGauge® has a broad set of powerful and easy-to-use image processing software tools that allow you to “clean-up” images that cannot be properly dealt with by the image analysis tools and transform them into imagery that can be successfully analyzed reliably.

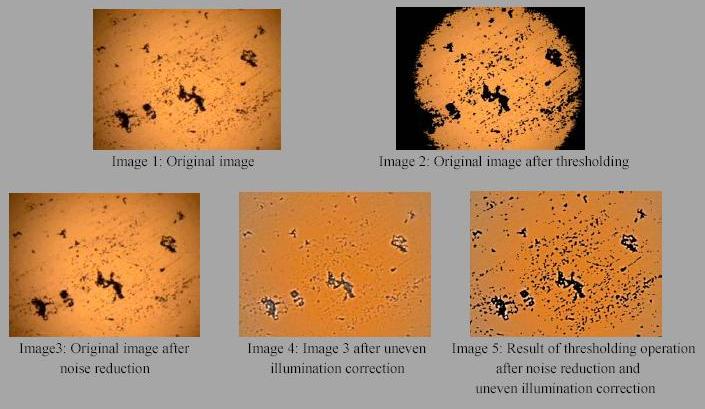
For example, the images below illustrate the dramatic improvement obtained by proper image pre-processing using VisionGauge®’s noise reduction and uneven illumination correction tools.

As can be seen in Image 2, it is impossible to apply a unique threshold value across the entire image to successfully extract the objects from the image background. However, Image 5 shows that – using VisionGauge®’s Counting & Sizing tool – the objects can be separated easily & reliably from the image background after applying VisionGauge®’s noise reduction & uneven illumination correction tools.

Download a .pdf with information about VisionGauge®’s Image Processing For Image Analysis software tools.

Focused-Based Image Blending (“Perfect focus”)

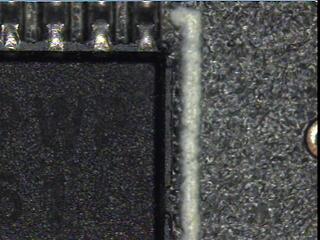
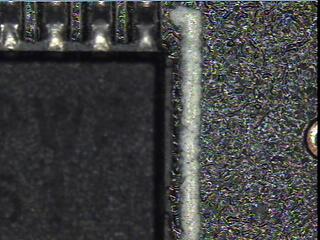
You can use this tool to combine two or more partially-focused images into one fully-focused image! This is extremely useful in applications where your instrument’s optical depth-of-field is less than the height of the features and topography on the sample.

This fully-automatic image focus blending tool works on color as well as greyscale images, and there is no limit on the number of component images that you can use.

Here’s a simple example:

1st partially-focused component image
2nd partially-focused component image: (the IC is out of focus and the board is in focus)
Resulting fully-focused image

With this tool, you can choose from 4 different automatic image blending algorithms:

  1. Best focus
  2. Weighted focus
  3. Power-weighted focus, and
  4. Adaptive (i.e. neighborhood-weighted best focus).

In practice, the 4th algorithm generally gives excellent results (and is always active by default), but the other 3 schemes are also available to give advanced users a maximum level of flexibility.

Download a .pdf with information about VisionGauge®’s Focus-Based Image Blending Tool.

VisionGauge® Measurement Tools, Statistics, & Reporting Features

High Precision Measurements and Measurement Statistics

Powerful & easy to use:

VisionGauge® is a powerful tool for non-contact visual measurements. It uses advanced edge-detection technology that produces sub-pixel accuracy, increases measurement repeatability and virtually eliminates operator dependent measurement error.

VisionGauge® is very simple to use and supports a wide range of measurement tools: from simple point-to-point measurements, diameters, radii, angles, and XY calipers to skew-corrected parallel hashlines and powerful and flexible marker-to-marker measurements, as well as fully-automated measurement software tools (e.g. line width, area calculation, and more).

Computing measurement statistics:

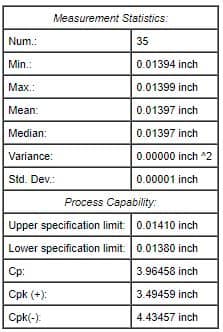
You can use VisionGauge® to compute measurement statistics, including sample mean, median, minimum and maximum, variance and standard deviation, as well as process capability statistics (i.e. Cp and Cpk). With VisionGauge®, it is easy to manage all of your data (i.e. images, measurements and statistics):

  • Link, store and recall all of your data with the easy-to-use integrated database and report generator
  • Save the information to disk
  • Print the information
  • Seamlessly transfer the information to other application

Example:

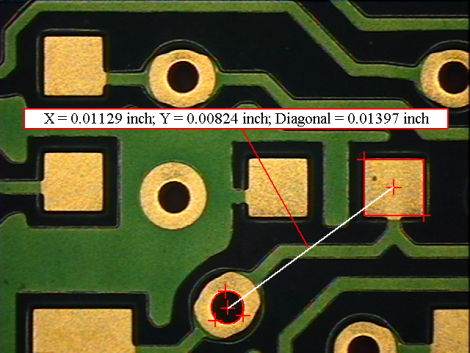
Here is an example of a simple marker-to-marker measurement. In this case, we are measuring from the center of the hole to the center of the pad. X, Y and “straight line” distances are shown:

Download a pdf with information about VisionGauge®’s Measurement Tools and Statistics Toolbox.

VisionGauge® Measurement Toolset

VisionGauge® has a wide selection of easy-to-use and powerful machine vision software measurement tools, including:

  • Point-to-point (i.e. “True Distance”) measurement
  • Horizontal distance
  • Vertical distance
  • Distance between arbitrary parallel lines (i.e. with built-in skew correction)
  • Simultaneous XY measurements
  • Diameter (using 3 or more measurement points)
  • Radius (also using 3 or more measurement points)
  • Angle measurement
  • Orthogonal line width (i.e. automated measurement tool)
  • Arbitrary line width (i.e. automated measurement tool)
  • Automatic circle (i.e. automated measurement tool)
  • Automatic angle (i.e. automated measurement tool)
  • Pathline measurement
  • Area measurement
  • Z measurements
  • Distance between a point and a plane
  • The area of a thresholded object
  • The equivalent diameter of a thresholded object
  • The equivalent radius of a thresholded object
  • Maximum X and Y dimensions of a thresholded object
  • Marker-to-marker measurements, where markers can be:
    • A point
    • The center of an XY rectangle
    • The center of a circle
    • The center of an arbitary triangle
    • The center of an arbitrary 4-vertex feature
    • The center of an arbitrary 5-vertex feature
    • Line midpoint
    • Orthogonal to line
    • Zero position
    • The centroid of a thresholded object
  • Advanced, fully-automated volume measurement tool
  • etc…

VisionGauge®’s Enhanced Database Search Tools
with “Thumbnail” Preview Image Gallery

VisionGauge® allows users to create customized measurement reports, storing an image, measurements, and text descriptions for each report. Reports can be used as templates for operators to fill in or standalone inspection reports for each part saved to the VisionGauge®’s integrated database.

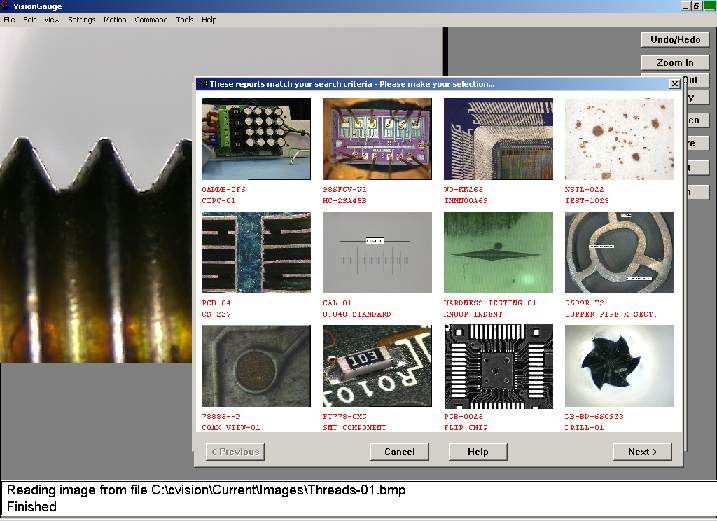
You can use VisionGauge®’s enhanced “Database Search” tools to call up all of the reports in VisionGauge®’s report database that contain a specific search string (for example: a date, an evocative keyword, a specialized term, etc…). These enhanced “Database Search” tools work seamlessly with VisionGauge®’s integrated Report Generator and Database.

To carry out a search, simply type-in a search string and VisionGauge® shows you all of the reports in which it can be found, sixteen at a time. For each matching report, VisionGauge®’s “Database Search” tools display a thumbnail preview image, along with two “key field” strings. Then, when you click on the image of the report that you’re looking for, VisionGauge® retrieves it from the database and loads it into the Report generator.

Specifying Tolerances for VisionGauge®’s Patented CAD Auto-Align™ & CAD Auto-Pass/Fail™ Tools

VisionGauge® offers two ways to specify tolerances. The first is to simply enter them directly in the VisionGauge® software. VisionGauge® has a simple and intuitive interface to allow you to do this quickly and easily. It is extremely flexible and supports the common bilateral “plus / minus” tolerances as well as “plus / plus” and “minus / minus” tolerances. Furthermore, VisionGauge® allows you to specify both uniform and linearly variable tolerances. All parameters can be set on an entity-by-entity basis and VisionGauge®’s “snap to entity” tool makes it easy – even in very busy drawings – to quickly set everything up.

VisionGauge® can also read in tolerances directly from CAD files. In this case, the tolerances can vary arbitrarily, i.e. uniform, linearly or otherwise… This is the absolute fastest way to setup CAD Auto-Align™ and CAD Auto-Pass/Fail™ operations. Everything can be setup in under a minute, with time to spare.

In both cases, VisionGauge® offers a wide range of display options, including the following:

  • hiding the nominal (to avoid clutter)
  • displaying the maximum deviation from nominal over either all or certain user-specified entities
  • displaying the search range
  • a wide range of line styles and colors as well as unique display modes
  • etc…
  • CAD Auto-Pass/Fail tolerances specified for an orthopedic plate